The dPanel dashboard is the first page after sign-in. It answers one question: is everything in this workspace all right? It shows a health verdict, one row of four tiles (servers, applications, load balancers and domains), failed jobs, and CPU, memory and disk usage across your servers. Open it any time from Dashboard in the sidebar.
The sidebar
The sidebar on the left is how you move around dPanel. From top to bottom:
| Item | What it opens |
|---|---|
| Workspace name | The workspace you are in. Press it to switch. See Workspaces. |
| Dashboard | This page. |
| Applications | Your applications. See How applications work. |
| Servers | Your servers and server groups. See Servers in dPanel. |
| Load Balancers | Under Backend. Publish an application on a domain. See Load balancers. |
| Domain & DNS | Under Backend. Your domains and their DNS records. See Domains and DNS. |
| Cloud Projects | Under Backend. Your connected cloud accounts. See SSH keys & cloud accounts. |
| Secret Managers | Under Backend. Opens the SSH keys page. See SSH keys & cloud accounts. |
| Your name | The settings icon on your card shows View Profile and Logout. See Your profile. |
At the very bottom, the EN button switches the language between English and Indonesian, and the moon icon switches between the light and dark theme. The theme is shared with other dPanel services on the same domain, such as the database manager.
The tabs
| Tab | What it shows |
|---|---|
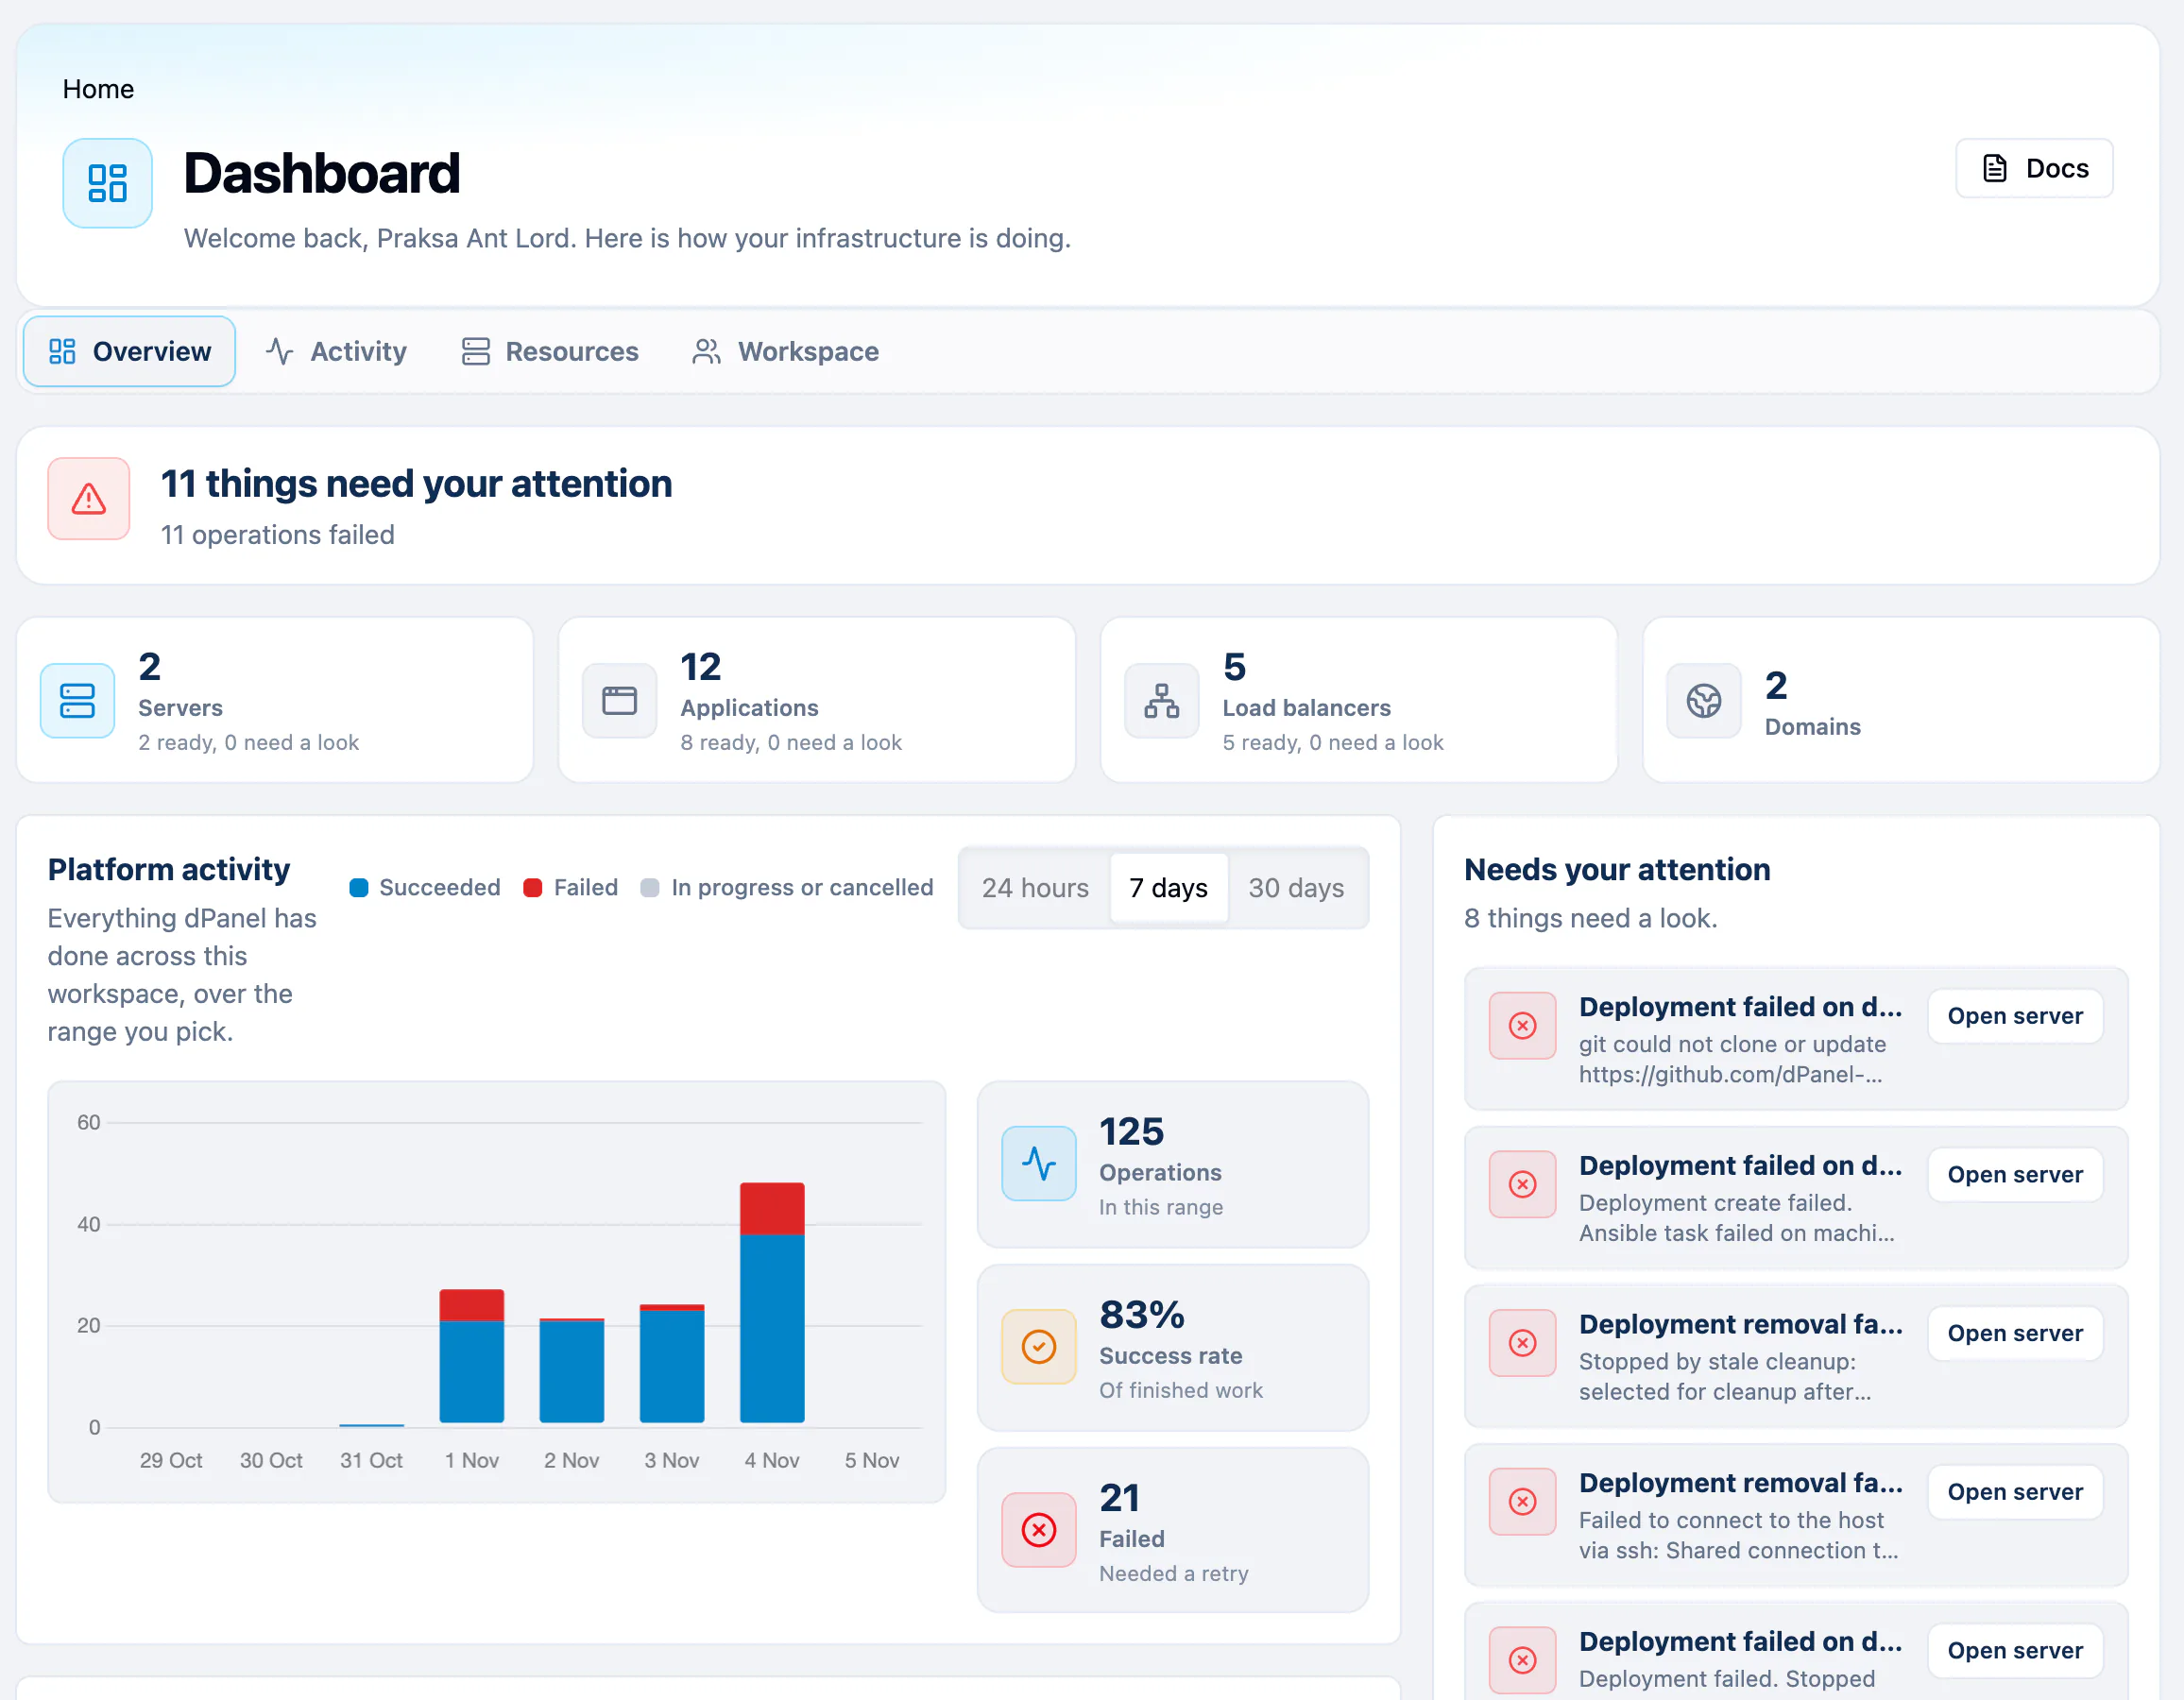
| Overview | A one-line verdict, four tiles, platform activity, resource usage, what needs a look, and recent activity |
| Activity | The platform activity chart and the full Recent activity list |
| Resources | Resource usage, Server Health, and short lists of servers, applications and load balancers |
| Workspace | Team workspaces only: the team summary, members and cloud projects |
Overview
Read it from the top.
- The verdict. Either everything is running normally, or a count of things that need your attention.
- Four tiles. Servers, Applications and Load balancers, each with how many are ready and how many need a look, and Domains. Press a tile to open that list. Cloud accounts and SSH keys are not counted here; open them from the sidebar.
- Platform activity. Every operation dPanel ran in this workspace, split into Succeeded, Failed and In progress or cancelled. Pick 24 hours, 7 days or 30 days. Beside it: the number of operations, the success rate and how many failed.
- Resource usage. CPU, memory and disk across your servers. Each chart shows the fleet average and the busiest single server. Pick 1 hour, 24 hours or 3 days.
- Needs your attention. Servers that are not running, servers whose agent (the small dPanel program on each server that reports its health) stopped reporting, and operations that failed. Open server takes you to the server in question.
- Recent activity. The newest operations. A button such as Show 7 more below the list loads the rest. The Activity tab shows the full list.
Activity
Recent activity lists what dPanel did to your infrastructure in the last two days: server setup, module installs, deployments. Each entry says what ran, on which target, who started it and how long it took. The person's name links to their public profile. Open Technical details for the raw detail of a failed run. Press Refresh to load the newest entries.
Resources
This tab is for capacity planning.
- Resource usage: the same CPU, memory and disk charts as on Overview.
- Server Health: how many servers are Ready servers, Provisioning or Needs attention, how many report live usage (Telemetry online), and which providers host them.
- Short lists of your newest servers, applications and load balancers, each with View all.
Workspace
Shown only in a team workspace.
- The summary at the top: the team's name and ID, its IaC repository (the Git repository dPanel writes this workspace's infrastructure to), and counts of members, servers and cloud projects. Manage team opens the team page.
- Workspace Members: who has access. Manage opens the team page.
- Cloud Projects: the provider accounts this team can launch servers in.
Lists, tables and cards
Every list in dPanel (servers, applications, load balancers, domains, cloud accounts, SSH keys and teams) opens as a table. The view switch beside the search box changes it to Card Grid View or Card List View, and back to Table View. Each row ends with its actions, such as Details, or a More (⋯) menu with Delete.
Search ignores upper and lower case: wordpress finds WordPress. The same goes for searching files and logs.
Ask a question instead
The Ask dPanel button at the bottom right of every page opens the AI assistant. Ask it, for example, "Did any job fail in the last 24 hours?". See Ask dPanel.
If the dashboard says it cannot check
You cannot see this workspace's health means dPanel would not let your account read execution and agent status in this workspace. Check that the workspace in the sidebar is one you belong to, then ask a workspace owner for access. See Members and roles.
Frequently asked questions
Why did the cloud projects and SSH keys tiles disappear?
The dashboard now shows one row of four tiles: servers, applications, load balancers and domains. Open cloud accounts from Cloud Projects and SSH keys from Secret Managers in the sidebar.
Why is the usage chart empty?
Usage appears a few minutes after a server becomes ready, and only for servers whose agent reports in. A workspace without a ready server has nothing to chart.
Why don't I see the Workspace tab?
It appears only in a team workspace. Your personal workspace has no members or team settings to show.
How do I switch to the dark theme?
Press the moon icon at the bottom of the sidebar. dPanel remembers the choice, and other dPanel services on the same domain follow it.